How to Show Variance against Multiple Baselines in a Microsoft Project Schedule
By default, in Microsoft Project (to the best of my knowledge) variances are calculated against only one baseline, the Baseline (Baseline0), and not against Baseline1 to Baseline10.
So how do you go about calculating and displaying variance against all saved baselines in a Microsoft Project schedule in addition to current saved baseline? In this video, I present a workaround using custom field to show Finish Variance against multiple baselines. This workaround can also be applied to Start Variance, Duration Variance, Cost Variance and Work Variance.
Addendum: Add Trend Graphical Indicator
To show how current Finish Variance compares against one of the previous Baselines’ Finish Variance (let’s say Baseline2 Finish Variance), follow the following steps.

Add a custom Duration field (I’ve gone for Duration10) and add the formula below to it.


Exit the Custom Fields dialog box and your table should look like below.

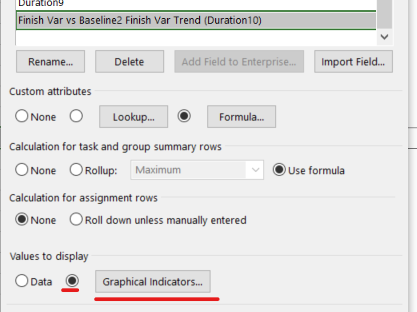
To add a Graphical Indicator, go back to Custom Fields dialog box and make the following changes.


Exit the Custom Fields dialog box and your final table should look like the screenshot below.
