How to Export Microsoft Project Data to Excel for Analysis
Export MS Project to Excel without summary tasks or units of durations.
If you have ever used Primavera P6, you would be surprised that exporting from Microsoft Project to Microsoft Excel does not provide you with a ready to be used data considering that both products are from the Royal House of Microsoft.
In Primavera P6, exports to Excel come formatted as an Excel Table for any data analysis you might want to carryout but with Microsoft Project, the default export comes with summary activities and units of duration, so you still need to work on your data in Excel before you can have it in an Excel Table format ready to use for analysis.
In this tutorial, I will show you how to set-up your Microsoft Project schedule so that you do not have to carry out extra manipulation of the export data to have it in a proper tabular state for analysis. This tutorial works with Microsoft Project 2010 but I want to think it will also work with later versions.
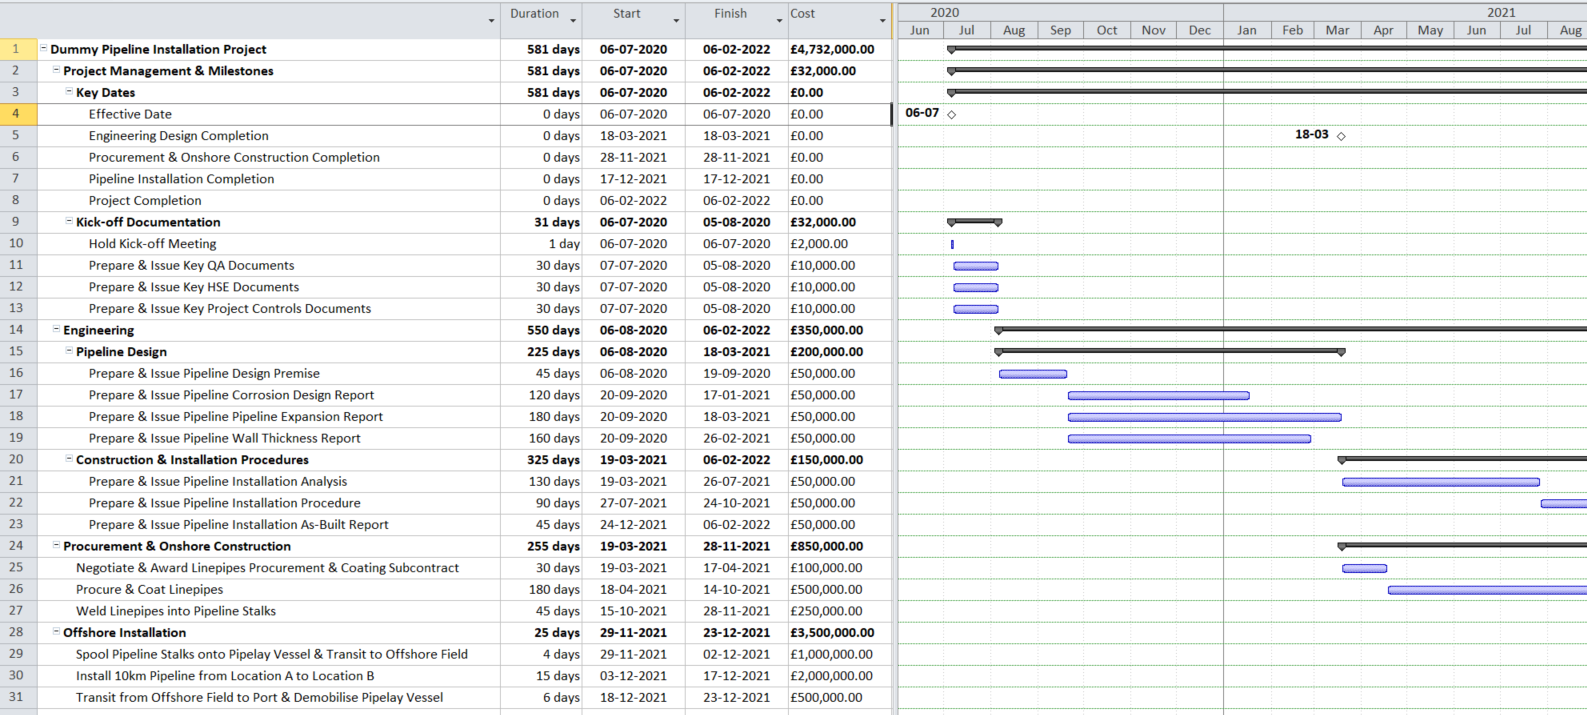
Assuming we have the Microsoft Project schedule below
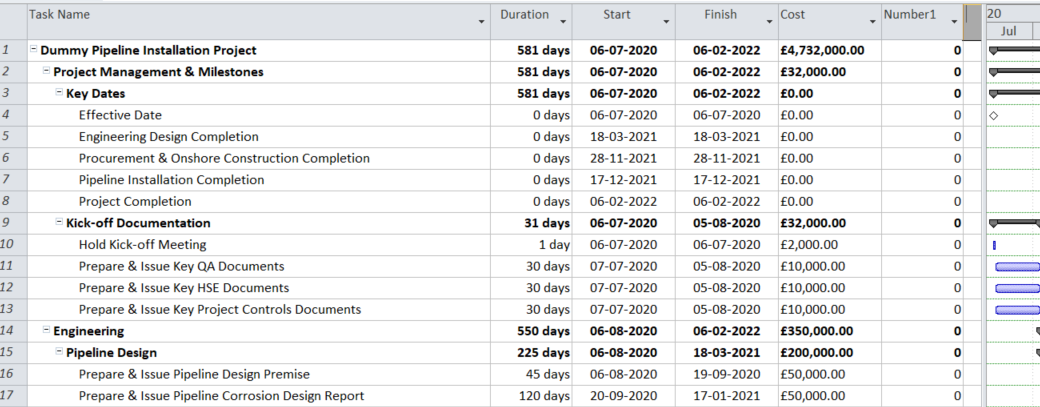
We start by creating and custom number field which will hold the Duration data but crucially without the unit of duration. Add a new column, Number1, to the view and the view should look like the screenshot below.
Next, we need to format this newly added Number1 custom field and we do that by having our cursor in the Number1 field before clicking on Format tab on the ribbon and then on Custom Fields in the Columns group and this will open the Custom Fields dialog.
Rename the Number1 field to Dur (days) and under Custom attribute check the Formula radio button and then add the formula below (click OK to any prompt message.)
[Duration] / ( 8 * 60)
Because Microsoft Project stores duration in minutes, we need to convert minutes to days when accessing durations via formula hence the divide by (8 * 60) where 8 is the hours per day in the project calendar and 60 is the 60 minutes in an hour.
Click OK to exit the formula dialog and also click OK to any prompt message. Then click OK to close the Custom Fields dialog. The schedule view should now look like the screenshot below.
You will notice that the Dur (days) field matches the Duration field but without the unit of duration and Summary tasks have 0 against them (we do not need summary task in Excel).
Next, we need to set-up a filter that would exclude Summary tasks from our export to Excel. Click on the View tab on the ribbon, and in the Data group, select New filter from the Filter dropdown menu.
In the Filter Definition dialog, name the filter, Export to Excel, tick the Show in menu checkbox and then add the criteria
Summary equals No
Click Save to close the Filter Definition dialog.
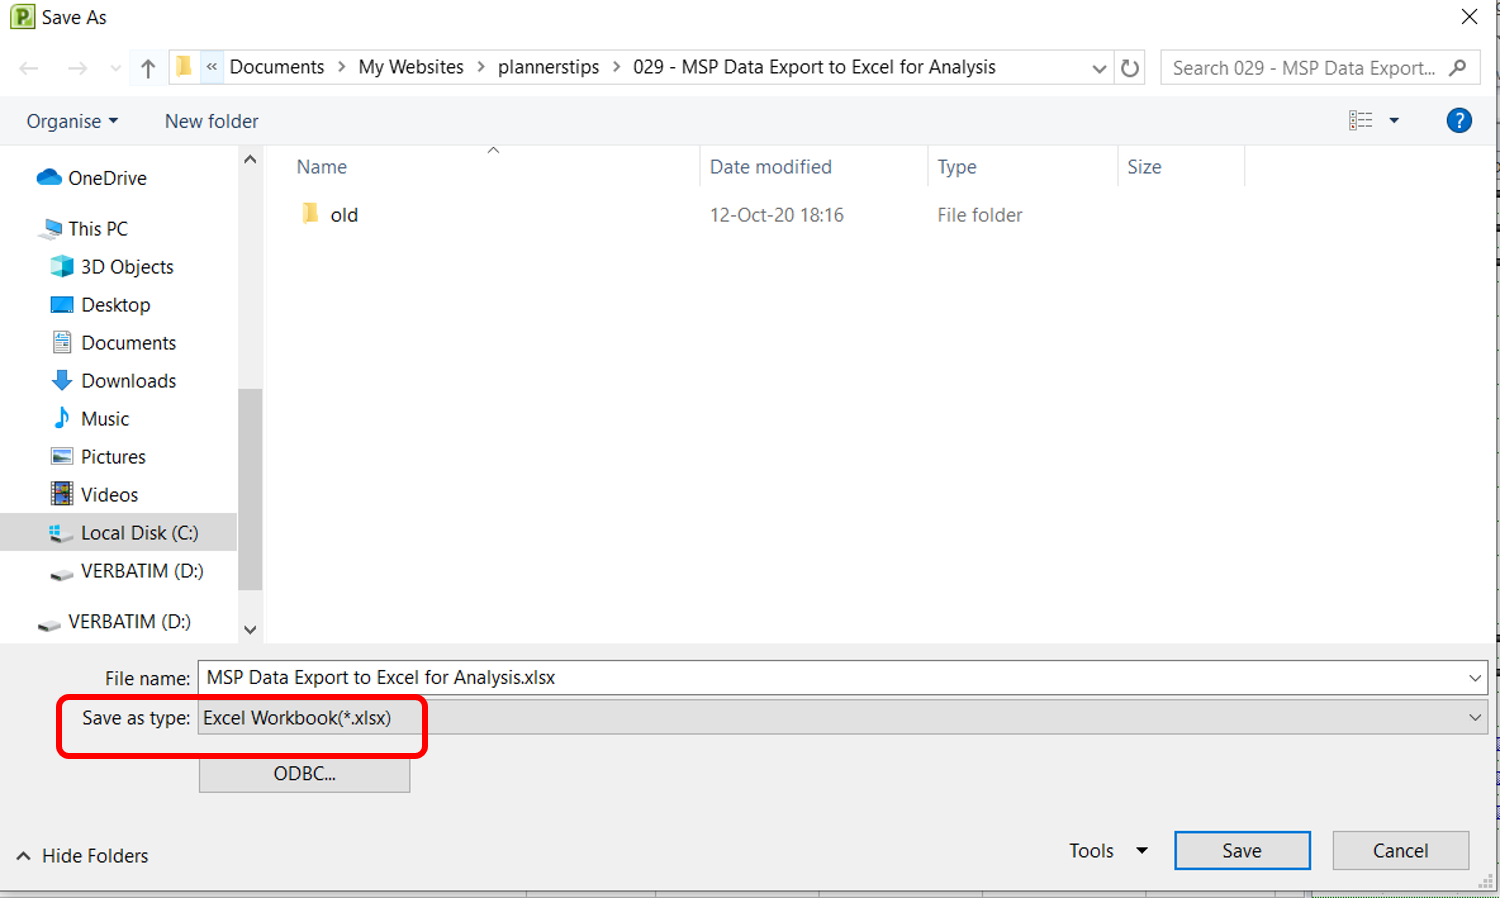
To export to Excel, go to File >> Save as and select Excel Workbook(*xlsx) from the Save as type: dropdown menu
In the Export Wizard dialog, click Next
In the Export Wizard - Data dialog, select the Selected Data radio button and click Next
In the Export Wizard - Map dialog, select the New map radio button and click Next
In the Export Wizard - Map Options dialog, select the Tasks and Export includes headers checkboxes and click Next
In the Export Wizard - Task Mapping dialog, select the Export to Excel filter from the Export Filter dropdown and under Verify or edit how you want to map the data, add the fields you would like to export to Excel. In this example, these are Name, Dur (days), Start, Finish & Cost.
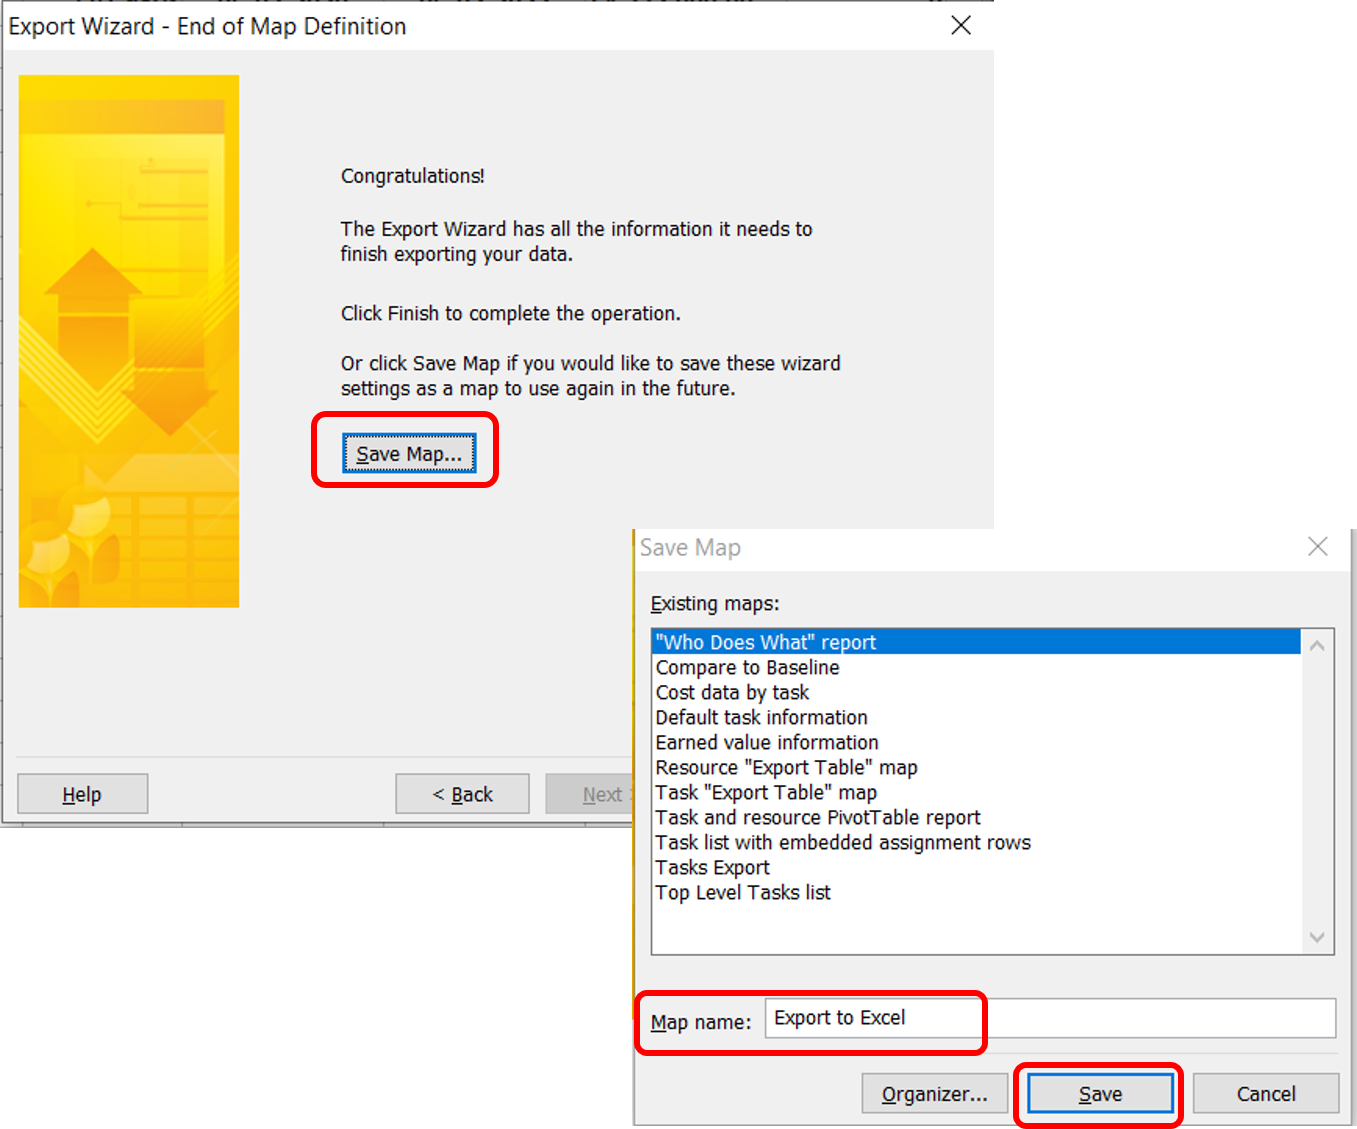
Click Next and in Export Wizard - End of Map Definition, click Save Map so that this map is available for future use and in the Save Map dialog, name the map as Export to Excel and click Save.
This will close the Save Map dialog and return to Export Wizard - End of Map Definition. Now click Finish, to complete the export to Excel.
Now open the Excel file (should be in same folder as the Microsoft Project file) and your schedule data will be presented in an Excel table format ready to use for data analysis as shown below.
Conclusion
You will notice that all fields have been exported as Text and you can easily clean this up within Excel by using the Text to Columns data tool for each column.


